Why Your USDA Hardiness Zone Changed in 2023
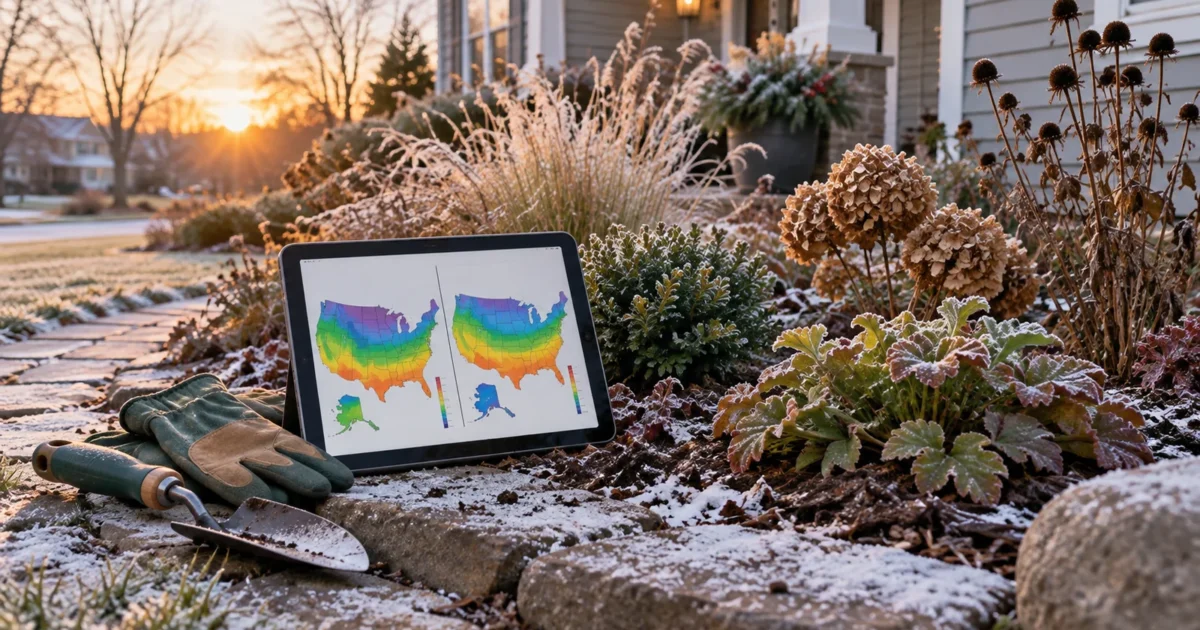
If you looked up your zone recently and got a different answer than you remember, you’re not misremembering. For a large share of American gardeners, the USDA hardiness zone changed in 2023 — not because a thermometer outside your house suddenly read differently, but because the USDA released a new edition of the Plant Hardiness Zone Map (PHZM) built on newer data and better methods. The map moved. Your yard may or may not have.
That distinction matters more than it sounds like it should, because it changes what you should actually do next. This guide walks through why the map changed, how to check your current zone the right way, what a shift means (and doesn’t mean) for plants you already have, and where the usual advice needs regional caveats.
Why Your USDA Hardiness Zone Changed in 2023
The USDA released the updated Plant Hardiness Zone Map on November 15, 2023 — the first update since 2012 — and it was jointly developed by USDA’s Agricultural Research Service (ARS) and Oregon State University’s PRISM Climate Group, according to USDA ARS. That’s a new map edition built from a new dataset, not a cosmetic redraw of the old one.
The core number the map tracks didn’t change: it’s still the average annual extreme minimum winter temperature, shown as 10-degree Fahrenheit zones split into 5-degree “a” and “b” half-zones (USDA How to Use the Maps). What changed is the data feeding that number. The 2023 edition is built on 1991-2020 weather-station records, a newer 30-year window than the previous edition used, drawn from over 13,000 weather stations, denser coverage than before (USDA How to Use the Maps; USDA ARS). USDA also refined the interpolation methods used to estimate temperatures between weather stations, which moves zone lines on its own, independent of any actual warming or cooling.
The practical result: about half the country shifted to the next warmer half-zone compared with the 2012 map, and about half stayed put, per USDA ARS. Some places even shifted cooler, because added data and improved interpolation don’t move in one direction — they simply produce a more accurate picture, whatever that picture turns out to be (USDA Map Creation). So if your zone moved from 6b to 7a, the honest read is “the map got better data,” not “my winters got half a zone milder” — those can be related, but the map update alone doesn’t prove it.
How to Check Your Current 2023 USDA Zone
Checking is the easy part. Go to the official USDA Plant Hardiness Zone Map, type in your ZIP code, or click your exact location on the interactive map, and you’ll get your current half-zone in seconds (USDA PHZM). If you haven’t done this since before 2023, don’t reuse an old number from memory or an old plant tag — USDA Plant Hardiness Zone: Find Yours & What It Means walks through the lookup and what the resulting number actually tells you.
Treat ZIP-code lookup as a fast first pass rather than a parcel-precise measurement. ZIP codes are mail-delivery constructs that don’t necessarily follow city or municipal boundaries, and the Census Bureau’s ZIP Code Tabulation Areas are approximate stand-ins for those postal service areas, not precise environmental boundaries (USPS; U.S. Census Bureau). If your address sits near a zone line, in a large rural ZIP, near a change in elevation, or close to open water, click your exact spot on the interactive map instead of trusting the ZIP result alone. Behind the consumer map, PRISM also publishes the underlying 2023 data as grids, shapefiles, KML files, and ZIP Code Listings — grid files carry the precise mean annual extreme minimum temperature values, while shapefiles and ZIP listings simplify that down to half-zone labels for everyday use (PRISM Climate Group).
One more habit worth building: whenever you see a hardiness zone quoted anywhere — a plant tag, an old article, a nursery catalog — check which map edition it’s citing before you trust it. A zone from a 2012-era source and a zone from the 2023 map aren’t necessarily the same number for the same address, for exactly the data reasons above.
Don’t Panic About Plants That Are Already Established
A warmer (or colder) number on the new map is not a reason to dig up anything that’s currently doing well. USDA is explicit on this point: a changed hardiness zone does not mean gardeners should remove existing plants or change what they’re growing, and plants that have been thriving will most likely continue to thrive (USDA How to Use the Maps). The map updating is not evidence that your specific garden’s conditions flipped overnight.
It’s also worth remembering how narrow the zone number actually is. USDA itself lists a long set of other survival factors the map doesn’t touch at all — wind, soil type, soil moisture, humidity, snow cover, winter sunshine, summer heat, and even how and where a plant is placed and planted (USDA How to Use the Maps). The University of Minnesota Extension backs this up from the horticultural side, noting that a plant’s real-world performance depends on planting, soil type, light, space, wind, and ongoing care in addition to whatever the hardiness map says (UMN Extension). A zone number moving by half a step changes none of that.
Can You Buy Plants for Your New, Warmer Half-Zone?
Here’s where professional guidance genuinely varies, and an honest answer has to say so rather than pick a side. USDA’s own framing is that the zone is an average, not the coldest temperature that’s ever occurred or ever will — so a newly “compatible” plant can still meet a colder-than-average night in a bad year (USDA How to Use the Maps).
University of Maine Extension takes the conservative route: be conservative when trying new plants, and to be more certain about a new plant, buy one rated one-half or even one full zone colder than your site’s rating (UMaine Extension). Ask Extension takes a middle path for gardeners whose mapped zone shifted warmer: it’s reasonable to try newly plausible plants, but budget for possible winter protection, remember the average can still be beaten by a cold snap, and trial a small number before committing a whole bed to them (Ask Extension). Neither source says a warmer half-zone is a green light to plant anything rated for it without a second thought.
There’s also a plant-type wrinkle worth knowing before you shop. University of Maine Extension notes the map is more reliable for trees and shrubs than for herbaceous perennials, because snow cover — which varies a lot from year to year and yard to yard — has an outsized effect on whether a perennial’s crown survives winter (UMaine Extension). A newly “compatible” perennial deserves more caution than a newly “compatible” shrub or tree.
What a Zone Change Doesn’t Mean
A few misreadings show up constantly once a hardiness map updates, and each one is worth correcting directly.
It isn’t proof your specific garden warmed. USDA is direct that changes in zones aren’t reliable evidence of whether there has been global warming, because the map represents 30-year averages of what are essentially extreme weather events — the coldest temperature of the year — while climate changes are usually based on trends in overall annual average temperatures recorded over 50 to 100 years (USDA Map Creation). That said, this isn’t a claim that warming isn’t happening anywhere — NOAA’s own climate normals show most of the U.S. was warmer in the 1991-2020 period than in the prior 1981-2010 period, with regional and seasonal exceptions, and UNH Extension makes the balanced case that the PHZM alone is too limited a dataset for a climate-trend claim even though broader, longer-running datasets do show a warming trend (NOAA NCEI; UNH Extension). The map update and the climate conversation are related but not the same evidence.
It isn’t a full climate profile. The zone number says nothing about summer heat, humidity, rainfall, or soil — it’s a winter-cold number and only a winter-cold number (USDA How to Use the Maps). If summer heat is your limiting factor, that’s a separate system: the American Horticultural Society’s heat zone map, built around the average number of days above 86°F, exists specifically because USDA’s map doesn’t cover it, and Sunset zones combine even more climate factors into a regional rating (U.S. Botanic Garden; University of Arizona Extension). If you garden where summers are hot, it’s worth looking at a heat-zone rating alongside your hardiness zone.
It doesn’t reset your vegetable calendar. Hardiness zones and planting dates get conflated constantly, but they answer different questions. Oregon State University Extension’s Eastern Oregon seed-starting schedule bases all of its indoor-sowing, transplanting, and direct-seeding recommendations on the region’s average frost-free date, and its vegetable guide divides Oregon into four growing regions and tells gardeners to choose planting dates suited to their own region’s growing conditions (OSU Extension: Eastern Oregon Seed-Starting Schedule; OSU Extension: Growing Your Own). UF/IFAS Extension answers the question directly: a hardiness-zone shift doesn’t mean you can plant tomatoes earlier, because the PHZM is built on extreme minimum winter temperature, while warm-season crop timing depends on your last frost date and the actual weather that year (UF/IFAS Extension).
Edge Cases: Alaska, Hawaii, Puerto Rico, and Beyond the U.S.
A few places need their own read on the 2023 map rather than the mainland-average story.
Alaska’s map shifted warmer more than most of the country, but USDA attributes that largely to the 2023 edition incorporating more mountain-region data and modeling winter temperature inversions — where warmer air sits over colder low-elevation valleys — rather than to uniform statewide warming (USDA ARS; USDA Map Creation). Hawaii and Puerto Rico are the only places where you’ll see zones 12 and 13, covering average annual extreme minimums above 50°F and 60°F respectively — mainland gardeners generally won’t encounter them outside of houseplant cold-sensitivity comparisons (USDA Map Creation). The official 2023 dataset covers the contiguous United States, Alaska, Hawaii, and Puerto Rico (USDA Ag Data Commons).
If you garden in Canada or Mexico, don’t assume the USDA map applies the way it does south of the Canadian border. USDA notes that the 1990 edition of the PHZM covered Canada and Mexico, but the 2012 and 2023 editions focus on the United States, including Puerto Rico — Canada maintains its own hardiness system, and Mexico doesn’t yet have an equivalent map (USDA Map Creation). Canada’s own current system is also built differently: it uses seven climate variables, including coldest-month minimum temperature, frost-free period, summer rainfall, and wind gust, rather than USDA’s single extreme-minimum-temperature approach (Government of Canada Open Data). Cities, mountains, and shorelines also complicate any single zone number, 2023 map or not. USDA notes that cities can map warmer because their large areas of concrete and blacktop hold more heat, higher elevations tend to run colder, and spots near large unfrozen bodies of water can stay milder, particularly downwind of the water (USDA Map Creation). The map is drawn at roughly a half-mile scale, the most detailed yet, but USDA is upfront that it still can’t resolve every microclimate — heat islands, frost pockets, sheltered spots, and low areas where cold air pools can all sit meaningfully outside their neighborhood’s mapped zone (USDA How to Use the Maps).
What to Do Next
Look up your current 2023 zone if you haven’t already, and treat it as your winter-cold baseline — not a full growing-conditions report. Keep whatever’s already thriving in your yard exactly where it is. For new perennial purchases, especially anything expensive or slow to establish, lean toward the more conservative end of the guidance above rather than assuming a warmer half-zone applies to every plant you’re considering. And keep your vegetable calendar tied to your local frost-free date, not your zone number.
Once you know your real 2023 zone, along with your site’s sun, soil, and moisture, the Explore plant finder uses that zone as its first filter and then narrows further by the conditions your yard actually has — so you’re shopping from a shortlist built on your current data, not an outdated number from a decade-old plant tag.
Why did my USDA hardiness zone change in 2023?
The USDA released a new edition of the Plant Hardiness Zone Map in November 2023, built on 1991-2020 weather data from over 13,000 stations and improved interpolation methods. About half the country shifted to the next warmer half-zone as a result, but that reflects a better dataset and mapping method, not necessarily a measured change at your specific address.
Should I remove plants that no longer match my old zone label?
No. USDA is explicit that a changed hardiness zone isn’t a reason to remove or replace plants that are already established and doing well. The zone update matters most for new purchases, not existing plantings.
Can I now plant things rated for my new, warmer half-zone without worry?
Treat it as more plausible, not guaranteed. Extension guidance varies here: some sources recommend choosing plants rated one-half to one full zone colder for margin, while others say it’s reasonable to try newly compatible plants if you budget for possible winter protection and trial a small number first.
Does a warmer 2023 zone prove my area got warmer?
Not on its own. USDA says PHZM changes aren’t reliable evidence of global warming because the map reflects 30-year averages plus changed data and methods. Broader, longer-running climate datasets do show general U.S. warming trends, but that’s separate evidence from a single map update.
Does the 2023 map change when I should plant tomatoes or other vegetables?
No. UF/IFAS Extension says a hardiness-zone shift doesn’t mean you can plant tomatoes earlier, because the map is based only on extreme minimum winter temperature, and it advises paying attention to your last frost date and local weather instead. Extension programs explicitly warn against inferring planting calendars from a hardiness-zone shift.
What if I garden in Alaska, Hawaii, Puerto Rico, or Canada?
Alaska’s shift is mostly a data and modeling story tied to mountain terrain, not uniform warming. Hawaii and Puerto Rico are the only places with zones 12 and 13. USDA says its 2012 and 2023 maps focus on the United States, including Puerto Rico, and that Canada has developed its own plant hardiness zone map. Separately, the Government of Canada describes that Canadian map as using seven climate variables.
Sources
- USDA ARS: USDA Unveils Updated Plant Hardiness Zone Map
- USDA Plant Hardiness Zone Map
- USDA: How to Use the Maps
- USDA: Map Creation
- USDA Ag Data Commons: 2023 PHZM Rasters
- PRISM Climate Group: 2023 PHZM Data
- University of Minnesota Extension: A New Plant Hardiness Zone Map from the USDA
- University of Maine Extension: USDA Plant Hardiness Zone Map
- Ask Extension: Planting for a Newly Warmer Zone
- OSU Extension: Eastern Oregon Seed-Starting Schedule
- OSU Extension: Growing Your Own
- UF/IFAS Extension: Impact of Hardiness Zone Change on Edible Gardens
- NOAA NCEI: U.S. Climate Normals
- UNH Extension: New 2023 USDA Hardiness Zones Explained
- U.S. Botanic Garden: Heat Zones, Plant Health, and the AHS Heat Zone Map
- University of Arizona Extension: Arizona Climate Zones and Their Application
- USPS: ZIP Code Basics
- U.S. Census Bureau: ZIP Code Tabulation Areas
- Government of Canada Open Data: Plant Hardiness Zones
The bottom line
Your USDA hardiness zone changed in 2023 mainly because the map itself was rebuilt — newer 30-year weather data, more weather stations, and better interpolation — not because every yard in America necessarily warmed by half a zone. Keep the plants that are already thriving right where they are, check your current zone by ZIP or map-click before buying anything new, and treat a newly “compatible” plant, especially an herbaceous perennial, with a little more caution than the map alone suggests. The zone remains one filter among many: it doesn’t set your summer-heat limits, your soil needs, or your vegetable planting dates. Once you know your real 2023 zone alongside your site’s actual conditions, the Explore plant finder can turn that into a shortlist instead of a guess.
More in this guide
- Perennials for Zone 4: What Actually Comes Back in a Cold Zone Perennials for Zone 4: What Actually Comes Back in a Cold Zone Search for perennials for zone 4 and you’ll get long…
- Last Frost Date: How to Use It (and What It Can’t Tell You) Last Frost Date: How to Use It (and What It Can’t Tell You) If you’ve ever typed your ZIP code into a…
- What to Plant in Fall (and What to Stop Planting Now) What to Plant in Fall (and What to Stop Planting Now) Every autumn the garden center is still stacked with tomato starts,…
- USDA Plant Hardiness Zone: Find Yours & What It Means USDA Plant Hardiness Zone: Find Yours & What It Means Your USDA plant hardiness zone is a single number that tells you…
Related guides
Perennials for Zone 4: What Actually Comes Back in a Cold Zone
Perennials for Zone 4: What Actually Comes Back in a Cold Zone Search for perennials for zone 4…
Last Frost Date: How to Use It (and What It Can’t Tell You)
Last Frost Date: How to Use It (and What It Can’t Tell You) If you’ve ever typed your…
What to Plant in Fall (and What to Stop Planting Now)
What to Plant in Fall (and What to Stop Planting Now) Every autumn the garden center is still…