Last Frost Date: How to Use It (and What It Can’t Tell You)
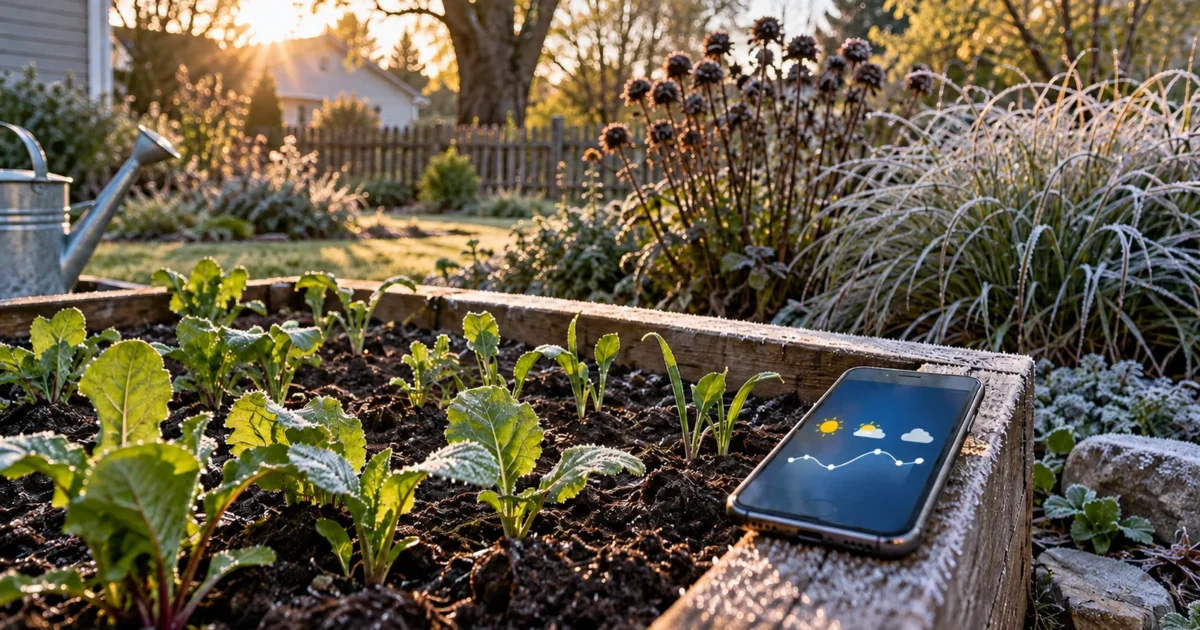
If you’ve ever typed your ZIP code into a planting calendar and gotten back a single, tidy date, it’s worth knowing what that date actually is. Your last frost date is a historical probability estimate built from decades of weather-station records — not a guarantee that frost is over, and not a permission slip to plant everything in your cart the next morning. NOAA describes the underlying data as official 30-year statistics for typical climate conditions, and its own last-spring-freeze explainer warns that any single year can vary widely from that average. Treat the date as a risk-management tool, and it becomes genuinely useful. Treat it as a promise, and it will eventually let you down.
This guide walks through what the date is actually measuring, how to read the percentages without getting the direction backward, why frost and freeze aren’t the same threshold, and — just as important — the specific things a last frost date can never tell you about your particular yard.
What Your Last Frost Date Actually Means
A last frost date is not a forecast. It’s a look backward at roughly 30 years of temperature records at a specific weather station, used to estimate the odds of a frost or freeze event after a given date in an average year. NOAA/NCEI’s U.S. Climate Normals are the official version of that kind of record — statistics calculated over a uniform 30-year period from almost 15,000 U.S. weather stations — and the current normals period is 1991-2020, the latest in a series of decadal releases. Older sources still floating around online, including some extension explainers, use example values from the 1981-2010 period; those are fine for understanding how the math works, but they shouldn’t be copied into a planting decision in 2026.
NC State Extension puts it plainly: freeze and frost probability dates are “best guesses” based on past records, and current or future conditions may not match them. NOAA’s own language is just as direct — a single year’s actual weather can vary widely from the historical pattern. Neither agency treats the date as a hard cutoff, and neither should you.
It’s also worth knowing that a broad, zone-level frost window is a first-pass estimate, not a precise measurement. NOAA/NCEI’s normals are published station by station, and its Full Access tool lets you search for station locations using a map or text search if you want the number your nearest weather station actually reports. A ZIP-level or regional estimate is a reasonable starting point; a station lookup asks the same question of one named station.
Reading the Percentages Without Getting the Direction Backward
This is where a lot of planting calendars quietly confuse people, because the same underlying risk gets labeled in opposite directions depending on the source.
NC State Extension’s NCEI-based tables report a spring “.10” date as a 10% chance that the last frost or freeze occurs on or after that date — meaning the risk keeps dropping as you move later in the calendar. NWS Cheyenne, by contrast, describes a comparably conservative late-season date as a “90% chance” date, meaning there’s a 90% chance the last freeze has already occurred by that date (and only a 10% chance of a freeze after it). Those are two different labels for the same idea, but only if you know which direction each source is measuring from. NWS North Platte, for what it’s worth, uses the same “chance of occurring after the date” direction as NC State, not Cheyenne’s by-date percentile framing — so the labeling isn’t even consistent across National Weather Service offices.
The safest wording, and the one this article uses throughout, is this: use the date after which the historical odds of another frost or freeze event are about 10%, and always name the temperature threshold you’re talking about. Avoid leaning on “the 90th percentile date” as a universal shorthand unless you’ve confirmed which direction that specific source is using. NOAA’s Climate.gov map reinforces why this matters for real planting decisions — it highlights the roughly 50% “average” last-freeze milestone first, then explicitly tells users that a 50% freeze risk can still be too risky for tender crops like tomatoes, and points them toward the lower-risk 10% probability date instead.
Frost, Freeze, and Hard Freeze Are Not the Same Threshold
“Frost date” gets used as an umbrella term, but the temperature thresholds behind it are distinct, and mixing them up understates real risk. NC State Extension identifies the standard agricultural thresholds as 36°F for frost risk, 32°F for freeze, and 28°F for hard freeze.
Those aren’t interchangeable. A freeze can occur without visible frost, and frost can occur without the air temperature ever reaching the official freeze mark — NWS St. Louis explains that conventional air-temperature readings often only need to be at or below 36°F for frost to form on plant surfaces, and NWS Tallahassee issues frost advisories for 33-36°F when frost is expected. That distinction matters because NOAA’s widely cited “Average Last Date of Spring Freeze” product is specifically about the 32°F freeze threshold, not the 36°F frost-risk threshold — so a tomato or basil plant can still take frost damage on a night that never registers as an official “freeze” at the nearest station.
Hard-freeze thresholds get even less consistent once you leave climate-normal tables. NC State’s 28°F figure works well for interpreting agricultural probability tables, and NWS Raleigh uses 28°F or below for its own hard-freeze watches and warnings. But NWS Tallahassee’s frost/freeze program uses 25°F instead, and notes that hard-freeze definitions can vary by local National Weather Service office. If you see a hard-freeze threshold quoted anywhere, it’s worth checking whether it’s describing a climate-table convention or a specific office’s operational alert criteria — they’re not always the same number.
How to Actually Use the Date When You’re Planting
The date is one input, not the whole decision. The more reliable order to work through it: start with what you’re planting, not with the calendar.
Cold tolerance varies enormously by crop. Extension sources group vegetables into rough categories — very hardy crops that can withstand hard frosts, frost-tolerant crops that handle light frosts, and tender or very tender crops that are injured or killed by any frost at all. Purdue Extension adds a useful split within the tender category: tender crops like beans, tomatoes, and sweet corn can go in after the average last spring frost, once minimum air temperatures are around 50°F, while very tender crops like peppers, cucumbers, eggplant, and melons should wait at least two more weeks, until minimum temperatures are closer to 60-65°F. CSU Extension frames the same idea by crop groups that go in before, near, or after the average last frost date.
Soil temperature can override the calendar entirely for warm-season crops. Maryland Extension notes that tomato, basil, and pepper roots simply don’t grow well in cold soil, and that beans, cucumbers, and melons need soil temperatures of at least 60°F to germinate reliably — Purdue confirms the same 60°F benchmark and adds that cool air and rain can keep soil from warming even after the calendar date has passed. A pepper planted into soil colder than about 65°F, per Maryland’s guidance, may not die, but it can effectively stall and “just sit there” instead of growing.
A different page — the Purdue Extension, Whitley County article “Plan and Plant a Vegetable Garden,” not the Indiana planting calendar cited above — shows where a local shortcut like “plant after Mother’s Day” comes from: that Whitley County article reports that a 32°F frost occurs after May 10-15 in only 1 in 10 years in Whitley County, Indiana, and calls that the general reference behind Mother’s Day being a “safe” frost-free day. It’s a local probability statement, not a universal rule you can transplant to a different climate.
The practical sequence, in order: figure out how frost-sensitive what you’re planting actually is, check your soil temperature if you’re dealing with a warm-season crop, then use your local last frost date — the conservative, lower-risk version described above — as the final gate before tender transplants go in the ground.
What a Last Frost Date Cannot Tell You
Four specific gaps are worth knowing before you lean too hard on any single date.
It can’t tell you what this particular spring will do. NOAA and NC State are both explicit that actual year-to-year conditions vary from the historical average — the date describes the past, not this year’s forecast.
It can’t tell you whether your soil is actually warm enough. As covered above, soil temperature is a separate measurement, and warm-season crops care about it more than they care about the calendar.
It can’t account for your yard’s specific microclimate. Frost likelihood varies within the same neighborhood because of wind, elevation, nearby buildings, and bodies of water, according to Maryland Extension. Penn State Extension adds that cold air physically collects in low spots, so a low corner of your yard can frost on a night when a slightly higher bed twenty feet away stays clear. Row cover reduces frost risk but doesn’t erase it — protection varies by fabric weight, and it’s still worth checking the forecast and field temperature before deciding whether to bother covering anything.
It is not the same thing as your USDA hardiness zone. These get confused constantly, and they answer completely different questions. Your USDA plant hardiness zone describes average annual extreme minimum winter temperature — a single number about how cold your worst winter night typically gets. Your last frost date describes the timing of a specific spring temperature threshold. A hardiness-zone shift, like the one covered in why zones changed in 2023, tells you nothing about when to move your tomatoes outside.
Regional Quirks Worth Knowing
Broad regional patterns are real, but they’re not a substitute for your own local number. In the Northeast and Southeast, NOAA/NCEI notes that last spring freeze dates generally get later as latitude increases; in the West, the pattern is more complicated because elevation and coastal influence both play a role.
A few places don’t fit the standard map at all. Puerto Rico can fall into a “too warm to compute” category for a meaningful average last-freeze date, while many Alaska stations are “too cold to compute” for the same reason — NOAA’s caveat here is essentially that not every location has a computable last-freeze date in a given map product, so a missing or unusual result doesn’t necessarily mean the tool is broken.
Regional tools exist too. The USDA Southeast Climate Hub lists an AgroClimate freeze-risk tool that provides freeze risk and expected first and last freeze dates with probabilities, based on the time frame and base temperature you choose. A regional tool like that doesn’t replace the basic exercise of finding your own station’s current normals before you plant.
What to Do Next
Start with your crop, not your calendar: figure out whether what you’re planting is frost-tolerant, tender, or very tender, and check soil temperature for anything in the warm-season category. Then look up your current last frost date using the conservative, lower-risk framing above rather than the first “average” number a calculator hands you. If your address sits near a zone boundary, in a low spot, or close to a large body of water, treat the number as a starting point and watch the actual forecast as the date approaches rather than trusting the historical average on its own.
Once you know your real last frost date alongside your site’s actual sun, soil, and moisture conditions, the Explore plant finder uses that information as a starting filter so you’re shopping from a shortlist built on your yard’s real data — not a folklore date borrowed from somewhere else.
What is a last frost date, exactly?
It’s a historical probability estimate — usually built from 30 years of weather-station records — describing the typical point in spring after which frost or freeze risk drops to a stated threshold, often around 10%. It’s not a forecast for the current year.
Is the last frost date the same as my USDA hardiness zone?
No. Your USDA hardiness zone describes average annual extreme minimum winter temperature — how cold your coldest nights typically get. Your last frost date describes spring timing. A hardiness-zone number can’t tell you when to plant tomatoes.
Why do some sources call it a “90th percentile” date and others call it a “10% chance” date?
Both can describe the same conservative, low-risk date, but they measure in opposite directions — one is the chance an event happens on or after the date, the other is the chance it has already happened by that date. Always check which direction a specific source is using before treating the label as universal.
Is 32°F the same thing as “frost”?
Not necessarily. Frost can form on plant surfaces even when the official air temperature reading sits in the mid-30s, above the 32°F freeze threshold. Most widely cited “last freeze” maps are specifically about the 32°F threshold, not the slightly higher frost-risk threshold.
Can I plant before my last frost date?
For frost-tolerant and very hardy crops, yes — extension sources routinely recommend planting those before the last frost date. Tender and very tender crops, like tomatoes and basil, need both a lower-risk date and warm-enough soil, so treat those separately.
Does row cover mean I can ignore the frost date?
No. Row cover reduces frost risk by a few degrees depending on fabric weight, but it doesn’t eliminate it, and it still needs to go on before a cold night and come off in time for pollination on flowering crops. Check the forecast rather than relying on cover alone.
Sources
- NOAA NCEI: U.S. Climate Normals
- NOAA NCEI: Last Spring Freeze
- NOAA Climate.gov: Average Date of Last Spring Freeze
- NC State Extension: Interpreting Freeze/Frost Probabilities
- NWS Cheyenne: Spring Freeze Statistics
- NWS North Platte: Spring Freeze Climate
- NWS St. Louis: Frost and Freeze Page
- NWS Raleigh: Frost/Freeze Maps
- NWS Tallahassee: Frost and Freeze Information
- Purdue Extension: Indiana Vegetable Planting Calendar
- Purdue Extension, Whitley County: Plan and Plant a Vegetable Garden
- CSU Extension: Vegetable Planting Guide
- University of Maryland Extension: When to Plant Vegetables
- University of Maryland Extension: Vegetable Garden Weather and Pest Protection
- Penn State Extension: Yard Microclimates
- USDA Plant Hardiness Zone Map
- USDA Climate Hubs: AgroClimate Freeze Risk Probabilities
Educational content only. Not a substitute for licensed professional or extension-office advice. Local frost patterns and microclimates vary by yard and by year. Use of any guidance from this guide is at your own risk.
Get the homeowner’s plant-shopping starter checklist — the questions to answer about your site before you buy anything. [Free download — enter your email]
The Bottom Line
Your last frost date is a useful, historically grounded starting point — not a promise and not the whole decision. Read the percentage in the direction that matches your source, keep 36°F frost, 32°F freeze, and 28°F hard-freeze thresholds separate, and let the crop’s actual cold tolerance and your soil temperature drive the final call rather than the date alone. Your specific yard, with its own low spots and microclimates, will always know more than any regional average — so treat the date as your floor for planning, and the forecast as your final word before tender plants go in the ground.
More in this guide
- Perennials for Zone 4: What Actually Comes Back in a Cold Zone Perennials for Zone 4: What Actually Comes Back in a Cold Zone Search for perennials for zone 4 and you’ll get long…
- Why Your USDA Hardiness Zone Changed in 2023 Why Your USDA Hardiness Zone Changed in 2023 If you looked up your zone recently and got a different answer than you…
- What to Plant in Fall (and What to Stop Planting Now) What to Plant in Fall (and What to Stop Planting Now) Every autumn the garden center is still stacked with tomato starts,…
- USDA Plant Hardiness Zone: Find Yours & What It Means USDA Plant Hardiness Zone: Find Yours & What It Means Your USDA plant hardiness zone is a single number that tells you…
Related guides
Perennials for Zone 4: What Actually Comes Back in a Cold Zone
Perennials for Zone 4: What Actually Comes Back in a Cold Zone Search for perennials for zone 4…
Why Your USDA Hardiness Zone Changed in 2023
Why Your USDA Hardiness Zone Changed in 2023 If you looked up your zone recently and got a…
What to Plant in Fall (and What to Stop Planting Now)
What to Plant in Fall (and What to Stop Planting Now) Every autumn the garden center is still…